|
New Way to Understand State Fiscal and Revenue Burdens
State tax policymakers are always concerned with how the level of taxation in their state compares with others. As a result, numerous statistical indicators have been developed to show relative taxation level. Some have even been bold enough to claim jurisdictions as “tax hells” or “tax heavens.” Despite some of these claims, there is no “right” or “wrong” way of measuring a state's tax burden. In most cases, the best measure depends on the questions you are asking. This article introduces a measure that is useful in answering the question "how well does a state utilize its resources to generate revenues for needed services." It uses data from a recently release report that updates estimates of a Representative Revenue System [RRS].
The Representative Revenue System [RRS], and its spending side equivalent the Representative Expenditure System [RES], was originally developed in 1962 by the Advisory Commission on Intergovernmental Relations [ACIR]. The measures look beyond what states actually raise in revenues and spend to what they could generate and what they would need to spend if following the national averages. The Urban Institute recently released a report, “Assessing Fiscal Capacities of States,” that provides improved and updated measures of RRS and RES. The study used 2012 data to make estimates.
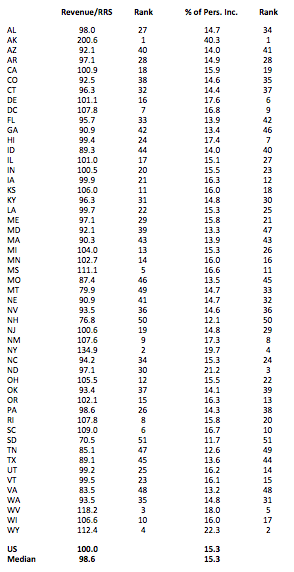
We focus here on the revenue side, using the RRS as a basis to compare actual collections. The chart to the right shows total revenue collections as a ratio of the representative revenue base for each state. In other words, what percentage of possible RRS revenues is each state collecting? For comparison, the traditional measure -- revenues as a percentage of personal income [per capita measures shown on the larger chart] -- is also shown. We see a wide divergence in the states. The index ranges from 135 percent in New York [note, the 200 percent in Alaska is largely due to oil royalties] to only 70 percent in South Dakota. Most states [38] are within 10 percent of the national average, and 21 states are within 5 percent.
When we compare the RRS burden to the traditional percentage of personal income measure, we see some changes. Hawaii, ranked as the 7th highest tax burden under the traditional measure, is actually utilizing its tax base well at 99.4 percent – ranked 24th. Similarly, Utah falls in the rankings from 14th in the traditional to 25th using RRS. On the other hand, Rhode Island, with revenues at 15.8 percent of personal income, is in the middle of the pack, but increases to a ranking of 8th, collecting 107.8 percent of its revenue capacity. Michigan increases from a ranking of 26th to 13th, and Illinois increases from 27th to 17th, under a revenue capacity measure.
The report also includes additional details on states’ revenue and expenditure systems. It provides estimates on revenue capacity and actual revenues for all tax and revenue sources. This allows an analyst to understand how policy choices have affected revenue collections and distributions. For example, the broad based Hawaii sales tax collections are double the estimated RRS capacity, while property taxes are less than half capacity. In addition, the report provides expenditure data allowing an analyst to understand how well state revenues systems are at providing for the needs of its citizens. Indeed, a primary conclusion of the report is that many states have a fiscal deficiency. These states cannot maintain current expenditure needs with existing tax policy.
The RRS/RES data provides added information for policymakers to understand their fiscal needs and abilities and is a useful tool to be added to any state tax policy analyst toolbox. It is available on the Urban Institute Website.
|
Comparison of Tax Burden Measures
Click on Image to View Larger Chart
|